Ask a classroom to line up from left to right and someone gets stuck. Where does a student stand who wants lower taxes and looser drug laws? Or one who wants tighter rules for corporations and for immigration? The line has no spot for them. Every attempt to draw a new political compass starts from that moment, from the two-axis charts of the 1970s to the four-direction model the sociologist Paul H. Ray circulated in 2002.
Here are six common beliefs about left and right politics, each checked against what historians, survey researchers and the model makers have documented.
Myth 1: “Politics has always run from left to right”
The line, which now organizes politics around the world, is younger than the U.S. Constitution. In the summer of 1789 the French National Assembly argued over how much power the king should keep, including whether he should hold a veto over new laws. Deputies who backed royal authority gathered to the right of the presiding officer, while those who wanted to limit it sat to the left.
The seating plan became shorthand. In Britain, “left” and “right” only became everyday political words in the late 1930s, during debates over the Spanish Civil War.
What changed since then is the load the line carries:
- In 1789 it sorted people on one question: the authority of the crown.
- Later it absorbed markets, religion, welfare, the size of government, war, migration and the environment.
- Each new issue was placed on the same line of the spectrum, whether it fit or not.
Myth 2: “One extra axis fixes the problem”
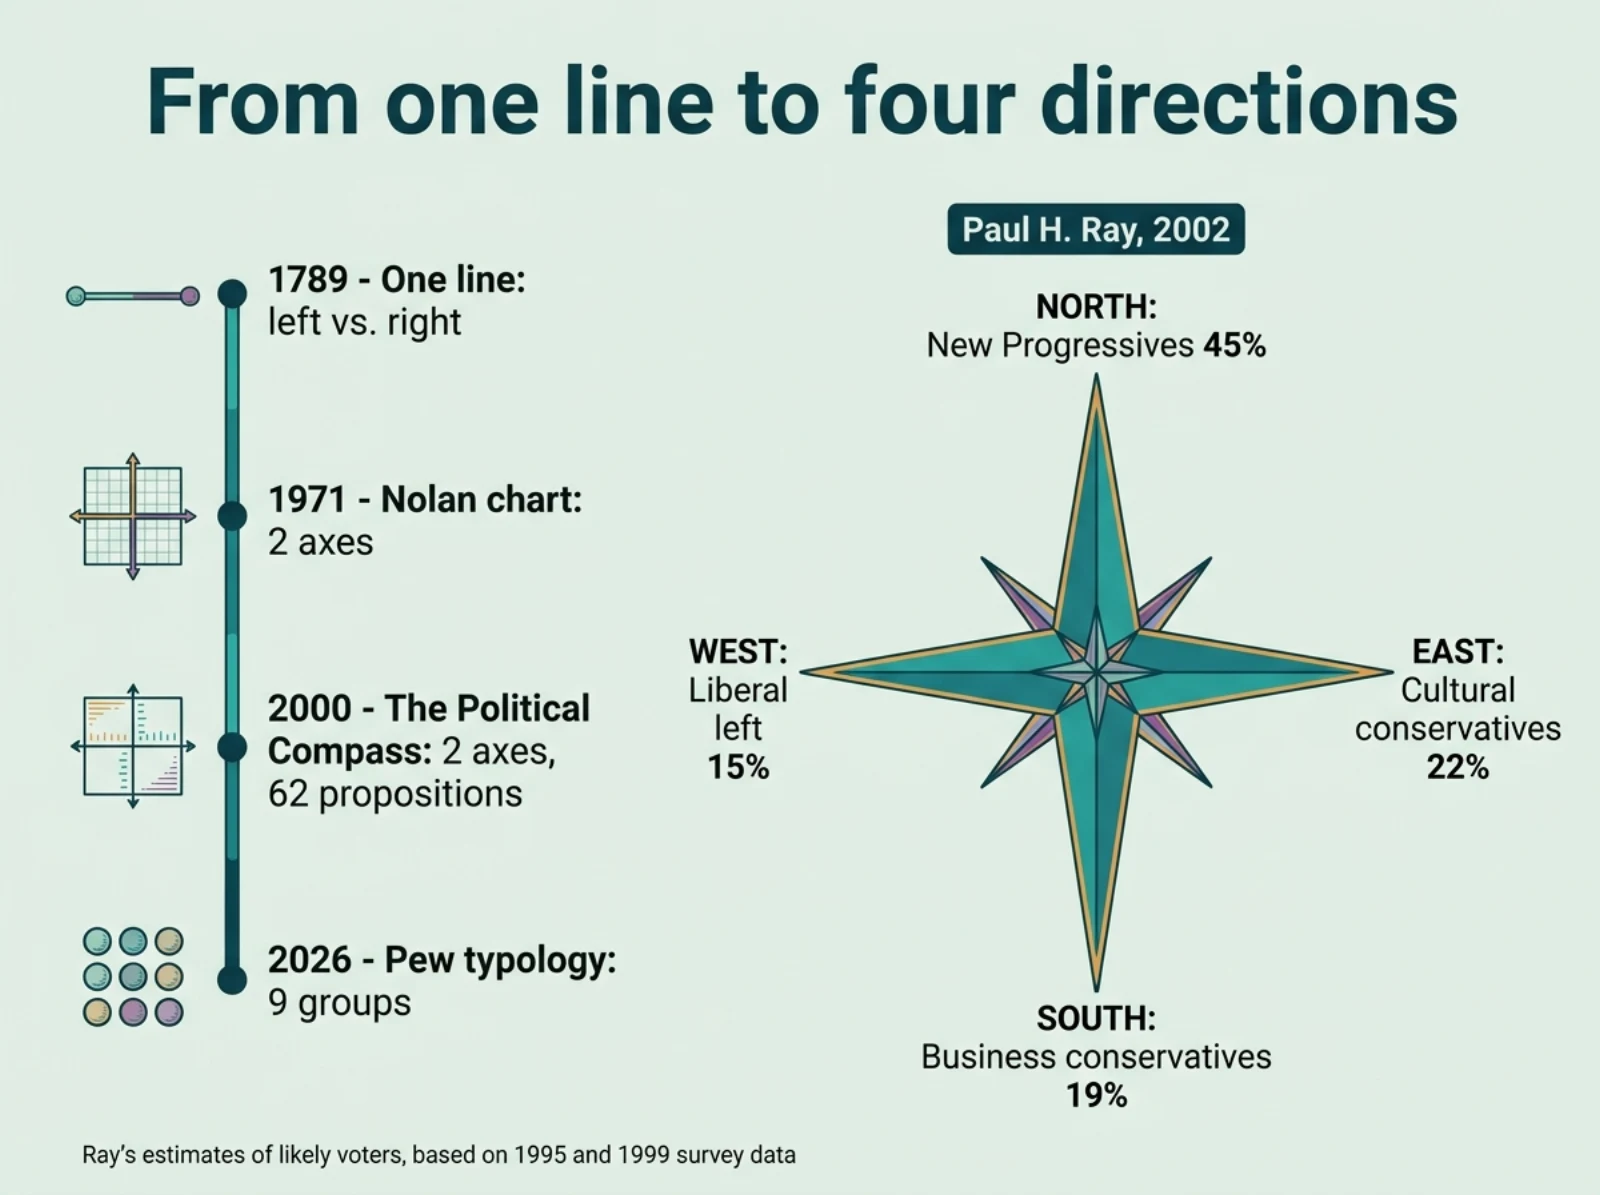
A second dimension is the oldest repair, but it brings its own trade-offs. The libertarian activist David Nolan published the original Nolan chart in the January 1971 issue of *The Individualist*. It plots economic freedom against personal freedom. Similar grids had appeared in 1968 and 1970.
The best-known online version is The Political Compass, created by the journalist Wayne Brittenden and launched in December 2000. Its 62 propositions place your answers on an economic left-right axis and a social axis running from authoritarian to libertarian.
Both tools have critics. The author Brian Patrick Mitchell argues that the Nolan chart can’t cleanly separate social and economic policy. Jacob Huebert, writing from a libertarian perspective, points to issues such as drug sales that are personal and economic at once. The academic Clifton van der Linden has argued that reducing all those answers to two scores gives inaccurate results, and the journalist Tom Utley complained that four answer options oversimplify.
| Model | Year | Structure | What it measures |
|---|---|---|---|
| Left-right line | 1789 | 1 axis | Originally the king’s power, later almost everything |
| Nolan chart | 1971 | 2 axes | Economic freedom, personal freedom |
| The Political Compass | 2000 | 2 axes | Economic left-right, authoritarian-libertarian |
| Ray’s New Political Compass | 2002 | 2 axes, 4 directions | Liberal vs. cultural conservative; “New Progressive” vs. business conservative |
| Pew political typology | 1987, latest 2026 | 9 groups | Values on government, economy, immigration and more |
Myth 3: “The new political compass is just the online test”
The phrase also names a specific model of the political landscape. Paul H. Ray, a sociologist and co-author of the book *The Cultural Creatives*, wrote it up as a discussion draft; version 7.3 is dated April 2002. He proposed reading politics like a map with four directions instead of a line, so that a shift could be described “at an angle, say northwest.”
In his own labels and estimates, the four directions were:
- West: the modernist liberal left, an estimated 15% of voters.
- East: cultural and religious conservatives, about 22%.
- South: business conservatives focused on economic growth and globalization, about 19%.
- North: a group he called “New Progressives,” concerned for the planet’s ecology, women’s issues, health care and the long-term future, and skeptical of big business. He put it at 36% of the population and 45% of likely voters.
A fifth group sat in the middle: people with little interest in government or politics, who rarely vote. In his view, an engaged “center” of moderate voters barely exists.
His numbers came from a 1995 survey he called the Integral Culture Survey, with roughly 1,000 respondents in his tables, plus a 1999 survey he labels the EPA survey. He reported that the north-south contrast was statistically independent of the east-west one, so he drew them at right angles. He linked its growth to the globalization protests of the time, such as the 1999 Battle of Seattle. In the cover letter he wrote that the draft was meant to “start progressives thinking” in new ways.
Myth 4: “Everyone fits neatly into a box”
The model grew out of earlier work with the psychologist Sherry Ruth Anderson. Their 2000 book *The Cultural Creatives* drew on what the publisher describes as thirteen years of survey research on more than 100,000 Americans. The authors estimated that about 50 million American adults, a little over a quarter, shared a set of values that included ecological concern and interest in the inner life, and they put the figure for Europe at 80 to 90 million. Someone counted as a cultural creative after agreeing with 10 or more of the traits on their list.
Mainstream survey research also finds that boxes fit poorly. The Pew Research Center’s 2026 political typology, the current edition as of October 2026, sorted 10,357 U.S. adults, surveyed November 17 to 30, 2025, into nine groups based on 30 questions. Pew built the groups “without taking partisan affiliation into account.” Four engaged, ideological groups make up about 39% of the public. The five more mixed groups form a majority, and Pew writes that “most Americans fall into groups within a large, politically messy center.” About 15% of people who identify with or lean toward each major party hold values that place them among groups on the other side.
Myth 5: “Moderates simply sit in the middle”
A single line suggests that a moderate holds middle-of-the-road views on every issue, but research describes something else. The political psychologists Stanley Feldman and Christopher Johnston argued in *Political Psychology* (2014) that economic and social ideology form at least two separate dimensions with different causes. In their words, a unidimensional model “provides an incomplete basis” for studying ideology, because the factors that predict economic views differ from those that predict social views. Someone being scored “moderate” on a single scale may simply combine a left position on one issue with a right position on another.
If no label fits, you can still take part locally: our guide to civic participation starts from the issue you care about.
Myth 6: “A better compass ends the argument”
Every map compresses, and Ray’s model has been questioned on several specific points:
- Old data: the compass rests on surveys taken in 1995 and 1999, which Ray himself wrote were in need of an update.
- Overlapping definitions: the same values questions identified both the cultural creatives and the compass positions, so, as Ray noted, most cultural creatives land in the north “by definition.”
- Researcher judgment: respondents were assigned to positions partly on the basis of the author’s own knowledge of where the groupings stand.
- A weaker second axis: in the 1995 data, the north-south split was “just half as strong” as east-west.
- Cutoffs: the 50 million estimate depends on the ten-trait threshold, and a different cutoff would produce a different count.
Supporters answer that the model was meant for orientation. Ray wrote that a compass orients people to what they need to see “rather than just labelling someone as right or left.” The broader case for more than one dimension also has support in academic and Pew research, even though Ray’s specific numbers rest on his own surveys. The search for an option outside a two-sided debate shows up elsewhere too, for example in Walter Wink’s third way in nonviolence.
Quick answers
Who created the new political compass?
The sociologist Paul H. Ray, in a 2002 discussion draft. The online test with a similar name is a separate project by Wayne Brittenden.
Is the online political compass test accurate?
It is a quick self-assessment tool. Critics question its wording and the reduction of many answers to two scores.
How many cultural creatives are there?
Ray and Anderson estimated about 50 million U.S. adults in 2000, plus 80 to 90 million in Europe, based on their own surveys.
Sources
- Pew Research Center: Beyond Red vs. Blue: The Political Typology (2026)
- Feldman & Johnston (2014): Understanding the Determinants of Political Ideology, Political Psychology
- Penguin Random House: The Cultural Creatives by Paul H. Ray and Sherry Ruth Anderson
- Wikipedia: Left-right political spectrum
- Wikipedia: Nolan Chart